We recently licensed our Floating point library for RISC-V to a large international corporation. They asked not only for our functional verification suite, but also for a verification of the verification suite. A code coverage report showing that the entire code had been executed. While we know that all lines and every instruction have been tested, it put us in a bit of a dilemma: How do we prove it?

Code coverage on real hardware

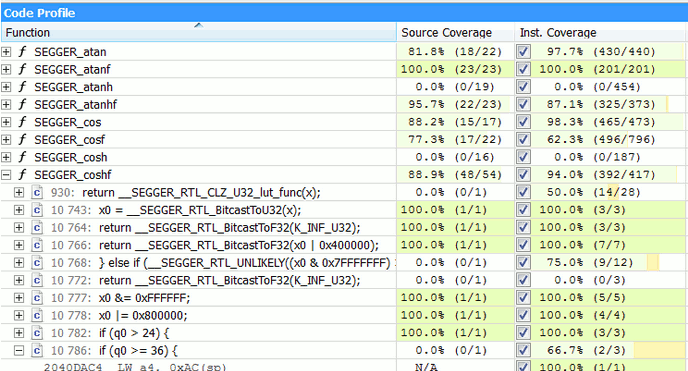
We have done code coverage reports before for other customers and other products, using Ozone and J-Trace PRO. J-Trace PRO is capable of doing streaming trace, transferring the trace information in real time to the host, which analyzes it in real time. Execution counters are updated, 2 for every instruction, counting “executed” and “not executed” for conditional instructions.
Ozone uses the counters to create and show an execution profile and code coverage of the application, in real time, during the program execution. This information can then be used to generate a code coverage report, which ideally shows 100 % coverage, meaning that all instructions have been executed. Unfortunately, J-Trace PRO is currently only supporting ARM CPUs…
How can we get a code coverage report for RISC-V in a short period of time?
Ozone and J-Link work with RISC-V, but so far we do not have a streaming trace solution (J-Trace PRO) for RISC-V. Trace for RISC-V is still evolving, and there is not yet a single standard.
So we looked at our options, and since we needed a solution quickly, we implemented an idea that I had had for a long time: Use the CPU simulator (which we have for all supported cores as part of the J-Link software to optimize debug performance) to generate CPU trace information, update execution counter information and make these available through the existing API.
Ozone would not see any difference between a streaming trace probe with real-time analysis and a simulation producing its results in real time.
Implementing the changes in the J-Link software
Well, the API was already there, the internals (execution counters) in place. We already had a core simulation for RISC-V CPUs.
It took some internal changes to be able to redirect things to the simulator instead of the trace hardware, such as mapping and simulating target memory, adding another CPU thread that “runs” the simulated CPUs, code to simulate breakpoints and more.
Testing the new features
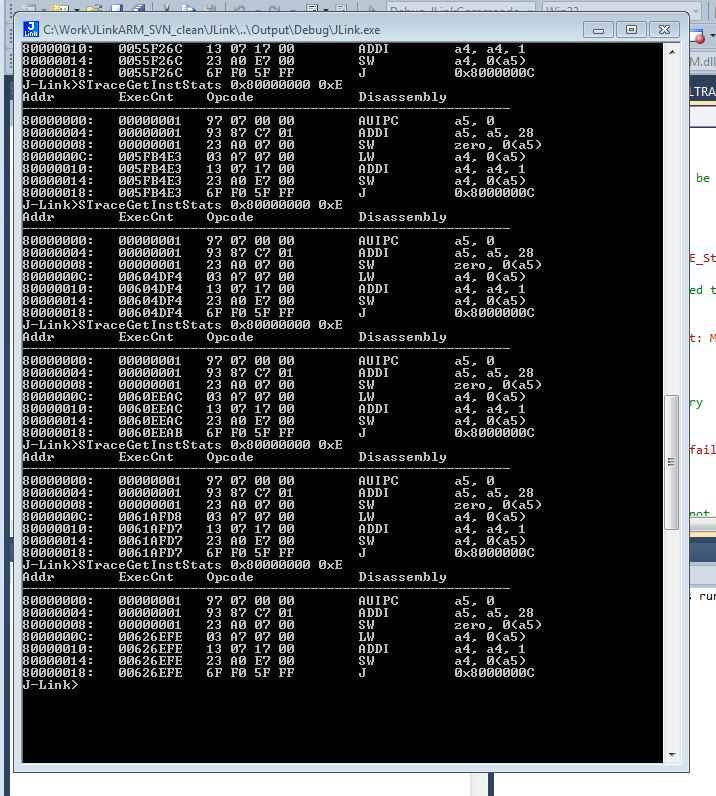
Tests for new features are usually done using J-Link Commander, a simple command line tool, and a simple target application, such as the one below, which basically just increments a counter variable in a loop. Something that would in C look as follows:
Cnt = 0;
for (;;) {
  Cnt++;
}

Note that the execution counters of the 4 instructions in the loop are different every time, since the simulated target CPU (RISC-V 32bit, RV32IMC) is executing instructions in the background, in another thread. It can also be seen that the counters of the instructions at the beginning of the loop are identical or one higher than instructions at a later point in the loop.
In short: Things are looking good and are ready to be tested with Ozone, the J-Link debugger and performance analyzer.
The result
The subsequent big test with Ozone was 100 % successful:
Ozone uses the J-Link / J-Trace API. The data generated by the simulation is presented by this API exactly the same way as the data collected by J-Trace PRO when reading and analyzing the data from the actual, physical target.
Everything feels exactly the same, in real time.
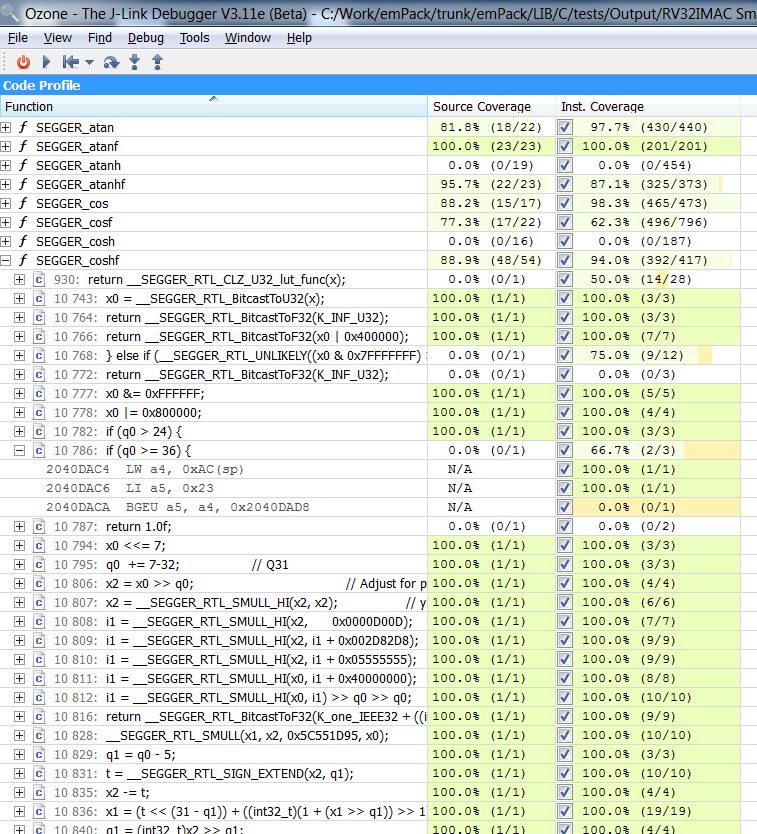
Below is a screenshot generated when running a test program on our floating point library.

Note one of my favorite features: The data is presented hierarchically, with the top level being individual functions. Every function has the PLUS sign to its left, indicating that more detailed information is available:
The same type of information is available per line of source code.
Every source code line now also has a PLUS sign. By clicking on it, the source line is expanded to show the individual CPU (assembly) instructions.
This makes it very easy and fun to look at the details of a program.
Ozone is actually capable of doing the same analysis also in “Release builds”, with compiler options enabled. Very important as profiling (looking at where code can be optimized) on a debug build without or very limited optimizations makes only limited sense.
Code coverage in action
Below is a 10-second video showing how the coverage information is collected and displayed in real time.
Will this be available outside of SEGGER?
We have not yet made this decision. It will take a little bit of time to do the “fine-tuning” of the simulation to bring it to our “It simply works” standard for end users.
I look at it the same way I look at a lot of other projects that we have done:
If we at SEGGER see a need for it, others likely have a similar need.
This is especially true since this simulator can also be used in combination with other tools that are compatible with J-Link. But for me, the best feature is that it allows code profiling and code coverage analysis without any hardware. Everything one needs can be on the development computer, no delicate or expensive or hard to get hardware required, no hardware that might not be available in the home office.
It is a perfect solution for performance optimizing a library or for creating code coverage reports.
It also allows fully automated performance and regression tests without hardware.
So we will probably make it available in the not too distant future, probably under the same “Friendly license” terms as Embedded Studio and Ozone, which allow easy unlimited evaluation and free use for non-commercial purposes.
If this is of interest, please let us know, stay tuned!
P.S.: It seems the RISC-V foundation has just made an important step towards standardizing Trace. Our plans are to add support for this in the not so distant future.
https://riscv.org/2020/03/risc-v-foundation-announces-ratification-of-the-processor-trace-specification/