J-Link debug probes do two important things: they download programs into RAM or flash memory, and they enable debugging in real time, with the setting of unlimited breakpoints, viewing of memory registers, and much more. Without this debugging ability, we are back to trial and error.
When the debug process just stops, with no way to proceed, it is called a “lock-up” or a “debug hang”. One such rare case is when a program, or a debugger, accesses external memory before the external RAM controllers have been set up.
We recently ran into this type of problem. We found it, fixed it, improved J-Link to avoid it in the future, and then gave all J-Link customers the new feature for free.
We are happy to announce that Dual Memory Maps are now a new, free feature of our J-Link.
What are Dual Memory Maps and what problem do they solve?
We are accustomed to thinking of programs as starting at main(). What happens before main() is thought of as “under the hood” and we simply expect the processes to work. So a problem that occurs before this, and especially one that locks up the debug logic and prevents any further debugging, is a huge problem. One such problem is when external memory is accessed before external RAM controllers have been set up.
With J-Link’s Dual Memory Maps, one memory map is used for handling memory access during the startup phase and a second memory map is used once initialization is complete. The first memory map prevents access to external memory. The second memory map permits full memory access.
This eliminates the possibility and problem of accessing external memory before setup is complete.
The recent problem that led to the J-Link update
While finalizing some new code in-house, during an otherwise uneventful development session, we hit a dead end. We had noticed a bug in some user interface code, rewritten it, and downloaded into the target as usual. When resetting the application, we got the message that the target connection had been lost. We checked all the physical connections and tried again …
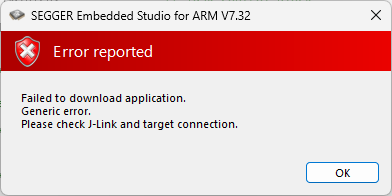
… and it failed again.
Power-cycling the target let us download the application again but with the same result.
The Culprit
It is not an easy problem to spot.
From the J-Link log file
JLINK_ReadMem(0x0033D4C0, 0x340 Bytes, …)
CPU_ReadMem(832 bytes @ 0x0033D4C0)
failed
– 40.959ms returns 1
We finally brought the issue to the PM who has many more years of experience than the rest of us with embedded targets and who is very familiar with the hardware platform at hand – the Xilinx XC7Z010. With one quick glance at the J-Link log file, he stated: “Found it.” (The speed of his discovery was almost as annoying as the problem itself.)
Embedded Studio was telling J-Link to read 832 bytes from address 0x0033D4C0 of the target, which on the XC7Z010 refers to memory located in external DDR RAM. The problem is that the DDR RAM must be initialized before it can be accessed. In this case, Embedded Studio was telling J-Link to read the memory immediately after resetting and starting the target application, which is prior to initialization.
That explains what happened, but not why it happened. We hadn’t added any code that would affect the DDR RAM initialization. Why did this occur, seemingly out of nowhere?
Bugs enter through an open window
It turns out that there was an open memory window showing memory contents at the address “aMyArrInExtDDRRAM“, an array in the external DDR RAM.
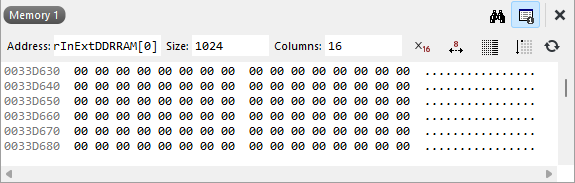
Not only had we not considered an open memory window to be the problem, to add to the obscure nature of the situation, the memory window was only visible during an active debug session. Otherwise, it was completely hidden.
No quick fix
It is easy to just say that memory windows shouldn’t be open at the start of a debug session, but there are many reasons why this doesn’t count as a solution. For example, a third party debugger could open a memory window by default, or not allow the user to close it, or something along those lines. Similarly, using the single-memory-map solution, enabling users to specify memory regions as “illegal”, will not work in this case. (For more info, see SEGGER Wiki article: Access to illegal addresses causes core to crash)
The Solution
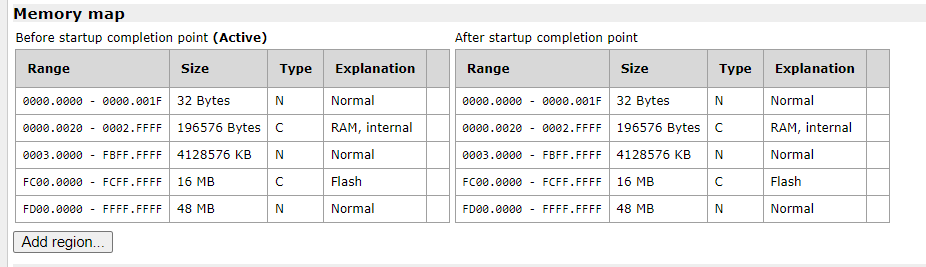
There are now two memory maps: One for handling memory access before reaching the startup completion point, and another for handling memory access after the startup completion point. Users can add custom regions to each map.
The access limitation of the first memory map acts like a safe mode. Once the process is safely past this phase, there is a dynamic switch to the second memory map, and it is full speed ahead.
Ease of implementation
Using the J-Link Control Panel, “excluded” regions can now be easily added to the first memory map, the map used by J-Link before the target application reaches its startup completion point.
Clicking “Add region…” opens a popup dialog:
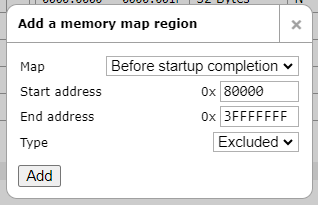
And that’s it.
From now on, J-Link will not access the external DDR RAM before it’s initialized.
One step further
In case of the XC7Z010, we even went a step further. A generic setup step for the XC7Z010 has been added to the J-Link software. With that, the external DDR RAM region of the XC7Z010 is, by default, excluded before reaching the startup completion point.
This may be what we do with all popular chips going forward.
Conclusion
J-Link now has Dual Memory Maps, another feature has been made available to all customers free of charge, and once again, the requirements of SEGGER’s most demanding customer has led to product enhancement.