When talking about tracing, you will mostly hear about the approach on the software side on how the trace data gets analyzed and all the associated benefits. But what about the hardware and any possible limitations?
The different trace types
Generally speaking, trace is an advanced debugging technique that offers the user a link between the target hardware and the host PC that can log the instructions that were executed on the target hardware. A trace debug probe, e.g. the J-Trace PRO, enables this link. That way, the logged information can be analyzed by software and provides users with the ability to see what their application did at any point in time since start of logging – which is somewhat comparable to a time machine for CPU instructions.
The most common trace technologies are:
- SWO PC sampling trace
- ETB/MTB/TMC instruction trace
- ETM/PTM instruction trace and live trace using pins
SWO (Serial Wire Output) is mostly used for printf() debugging via a dedicated hardware pin. But it can also be used for statistical tracing via PC (program counter) sampling. While it is the most broadly implemented trace technique, it comes with some hefty drawbacks. One of the most prominent is the extremely limited bandwidth. Another one stems from the fact that the PC is only sampled periodically, therefore “real-time” analysis, such as code coverage, can only be evaluated sufficiently over long periods of time to make sure all code was actually covered by the PC samples. However, this is not always practical.
Note: Should you read this article because of printf() debugging via SWO, we recommend using SEGGER RTT instead as it eliminates the need of a hardware pin and is significantly faster.
ETB (Embedded Trace Buffer) trace offers continuous instruction trace. That way, code coverage and code profiling become possible, but only for a limited amount of time. This is due to the limited ETB size of usually 4-8 kByte. On the plus side, no additional hardware pins are required for this trace type.
If instruction trace over longer periods of time is needed, ETM (Embedded Trace Macrocell) for Cortex-M and Cortex-R devices, and PTM (Program Trace Macrocell) for Cortex-A devices can be used. The trace information is output via dedicated high-speed GPIOs, which usually run at half the CPU clock speed. This is why this technique is usually also referred to as pin trace. This technique offers continuous instruction trace with high bandwidth, making it possible to even trace target devices with very high CPU clocks during run time. The only drawback is that dedicated high-speed GPIOs need to be reserved for this debug technique (a minimum of two pins, but usually five), but the gained debug benefit is generally worth it.
More technical information about each trace type can be found on our Wiki.
What about the target hardware?
All currently available ARM-based devices have one thing in common when it comes to tracing via pins: They are all running into GPIO clock speed limits before running into any debug probe limits, at least for fast trace probes like the J-Trace PRO.
As a general rule, the trace clock speed that is being output by a designated high-speed GPIO pin is set to half the speed of the CPU clock. This works well up to a CPU clock of around 200 MHz, which results in trace clocks of around 100 MHz. But what happens if target devices have CPU clocks of 300 MHz and higher?
So far, none of these higher-speed devices follow the rule of using half the CPU clock speed as the trace clock speed. But why? As SEGGER is not an MCU vendor we can only speculate here, but we have a pretty good idea why.
To implement high-frequency GPIO drivers on an MCU, you mainly need two things: more space and more power. Both are not really desired properties for “micro” devices as they generate additional cost and heat.
It seems that GPIO drivers capable of up to 120 MHz are a current sweet spot in the industry when it comes to the trade-off of power consumption and debug features.
The following table illustrates this imbalance between the maximum CPU speed and the maximum possible trace clock speed with a selection of some of the popular higher-speed ARM devices that support pin tracing:
* The actual maximum achievable trace clock speed for this target device under lab conditions was 118 MHz
All tests were conducted using the example projects available here and a J-Trace PRO Cortex.
The table shows the maximum CPU clock for each device and the respective maximum supported trace clock that can be set on eval board hardware. As you can see, up to 240 MHz CPU clock the devices follow the rule TCLK = CPUCLK/2 and the trace clocks are actually achievable.
But go higher than that, and suddenly the maximum supported trace clock hits a threshold, and in some cases the maximum supported speed is not even achievable.
So in short:
The ARM target devices are getting faster and faster but their trace debug features have trouble keeping up.
What does this mean for SEGGER?
First, let’s take a look at what we have to offer to our customers when it comes to tracing.
Our current trace debug portfolio features two J-Trace PRO units; one just for Cortex-M devices (J-Trace PRO Cortex-M), and one for Cortex-A/R/M devices (J-Trace PRO Cortex). SWO, ETB/MTB/TMC, and ETM trace are supported on both debug probes. PTM is exclusive to the J-Trace PRO Cortex model. Both can analyze trace clocks of up to 150 MHz and handle bandwidths via USB 3.0 of up to 1.2 Gbit/s.
Looking at the current state of the ARM trace market, we can confidently say that at this point in time we can cover the entire ARM trace market with a single trace debug probe that can be set up within minutes.
To protect your trace debug probe, we introduced the new J-Trace Isolator. It supports trace clock speeds of up to 75 MHz while isolating your J-Trace PRO debug probe from the target circuit. (With some adjustments to the default example project, the Renesas Synergy S7G2 could also be traced at full speed (120 MHz), so the 75 MHz is only the officially supported maximum speed for the implemented digital isolators).
For the best tracing experience, we recommend using our debug software Ozone, which is free to use with a J-Trace PRO debug probe. You get the newest trace features of our debug probe, plus you get access to an extensive set of preconfigured example projects for popular target devices for tracing that run out-of-the-box.
The following image shows some of the Ozone trace features in action.
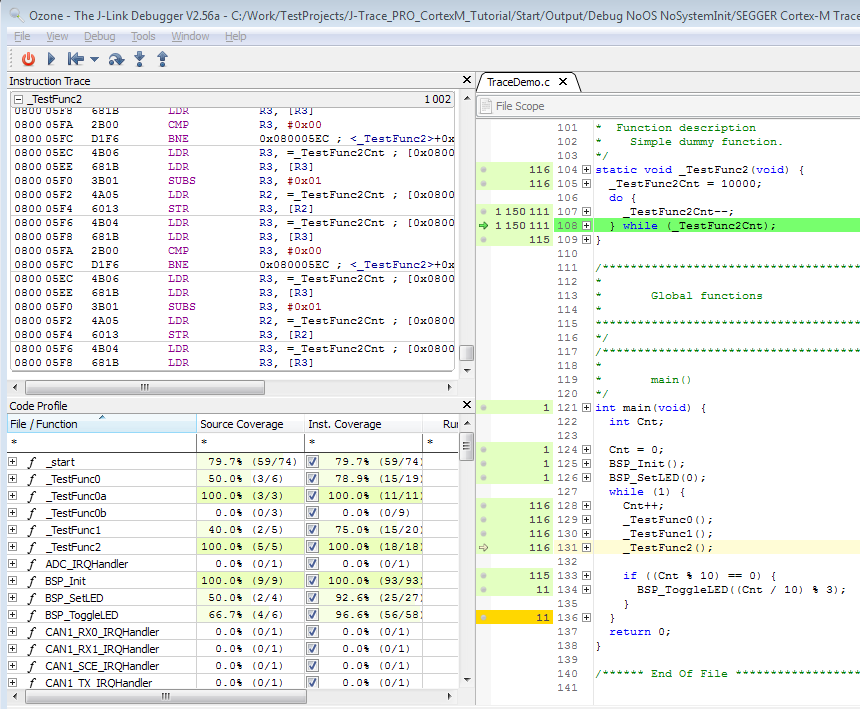
In summary, we at SEGGER currently cover the complete ARM market with regards to tracing with a single debug probe that is easy to set up and simply works!