At SEGGER, we’ve always been passionate about supporting students throughout their academic journeys. We believe in providing hands-on experience and real-world opportunities across our various departments to help students grow both professionally and personally. By working alongside our expert teams, students gain invaluable skills and insights that go beyond theoretical knowledge.
Today, we’re excited to introduce Jannis Widmer who has been working on an interesting project that we’d like to share with you: J‑Probe. But instead of us explaining it, let’s hear directly from Jannis himself.
Meet the developer
Hi everyone!
I’m Jannis, a computer science student, and part of SEGGER’s J‑Link team, with whom I have the opportunity to develop tools like J‑Probe.

What is J-Probe?
The core idea behind J-Probe is to provide a customizable graphical user interface (GUI) that allows developers to interact with and visualize the internal data of an embedded system while the application is running.
Let’s think about a practical scenario: Imagine you’re developing software for a washing machine. Once the main development tasks are complete and debugging is finished, it’s time to test the actual behavior of the system. You could simulate user inputs, but things like checking the water temperature, ensuring the door is securely closed, or observing system alerts are tricky or require a lot of effort to duplicate in a real-world testing environment.
With J-Probe, you can easily simulate and visualize these conditions on your computer. You can add virtual elements, such as sliders, buttons, and checkboxes, to interact with your system’s variables, all while the target system continues to run. These inputs can be controlled via keyboard, mouse, and even a joystick, offering flexible and intuitive interaction.
How J-Probe works
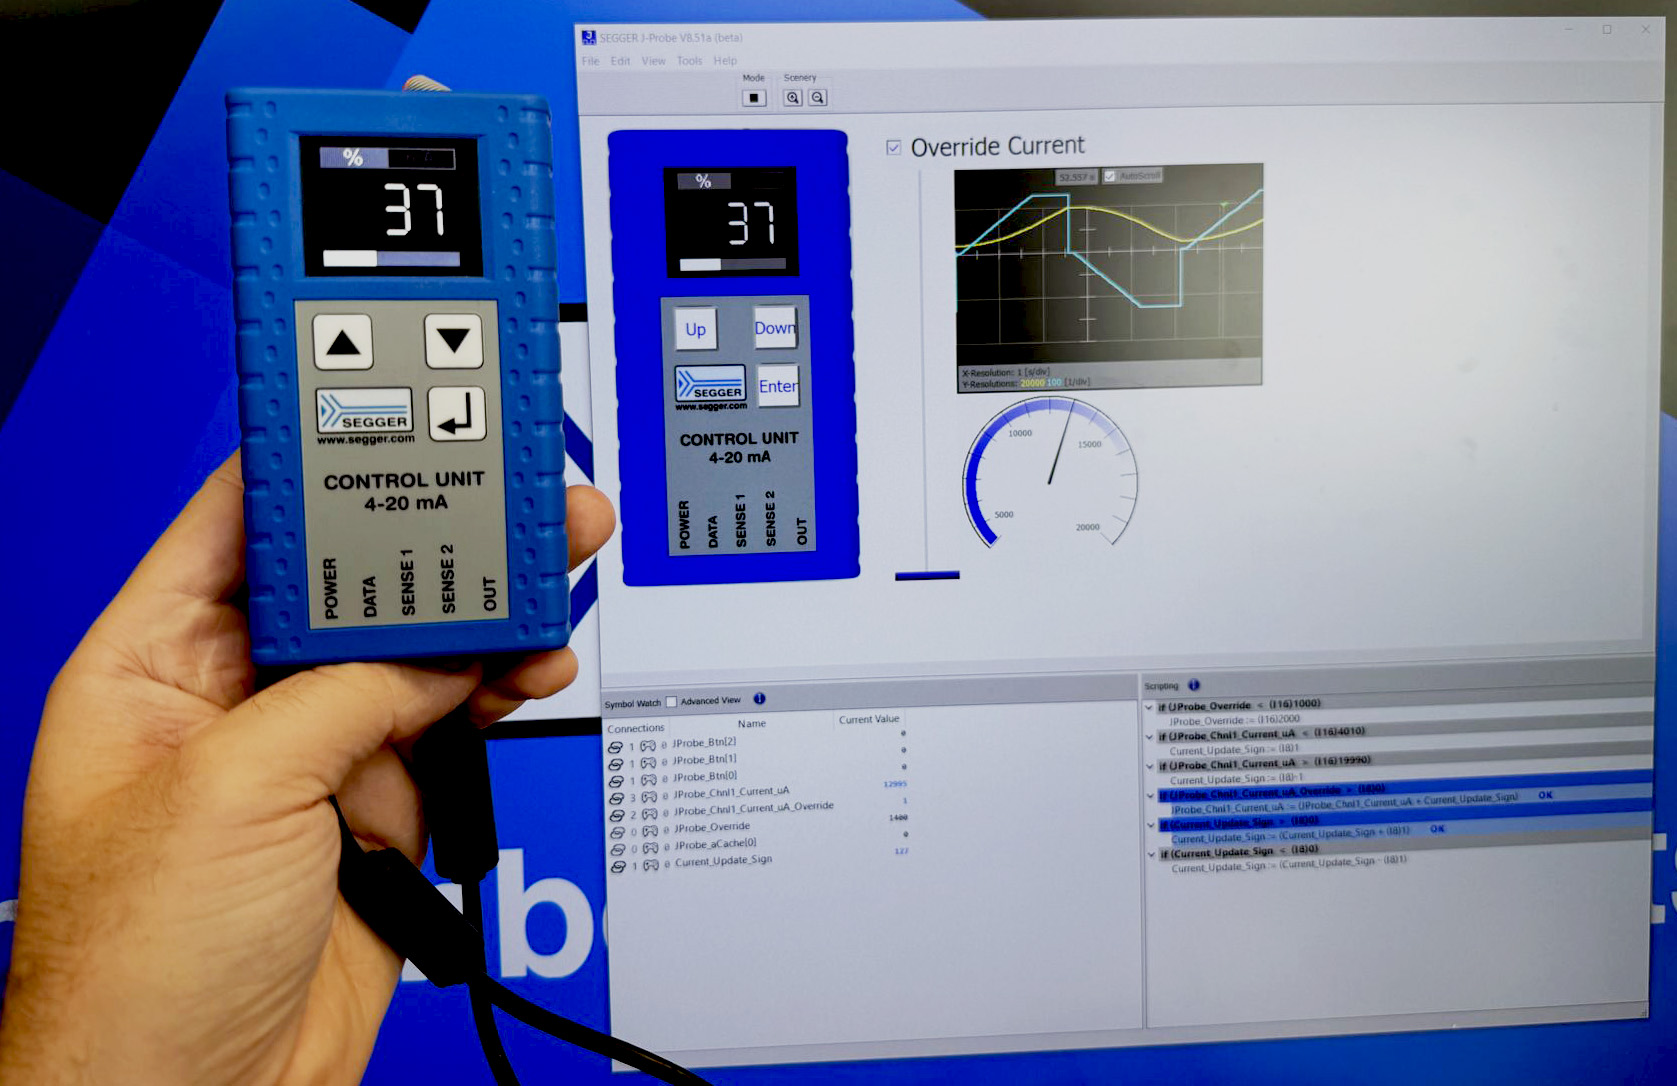
J-Probe connects to a microcontroller via SEGGER’s J‑Link, and it allows you to monitor and modify variables defined in the application’s ELF file. With support for customizable GUI modules, such as sliders, gauges, and even oscilloscopes, you can visualize data in a way that makes it easy to track and adjust system behavior. Whether you need to adjust a value in real time or visualize data trends, J-Probe gives you the tools to do so in a way that’s both intuitive and precise.
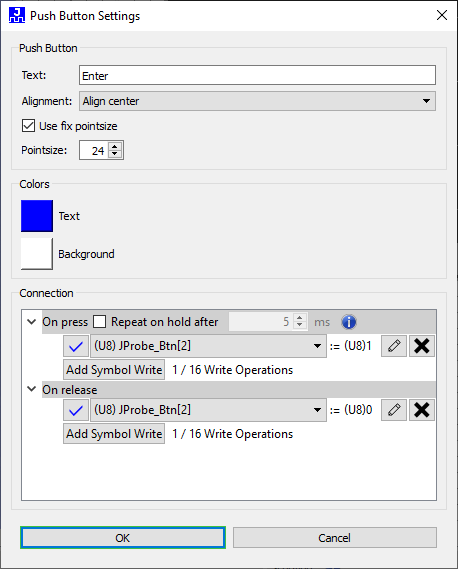
Some GUI modules are purely for visualization, while others—like push buttons—can actively write to variables on the target device. These interactive modules are typically controlled using the mouse. Although the keyboard is primarily used for editing and configuring the GUI layout, J‑Probe also supports external input devices such as joysticks and game controllers. These can be connected and mapped to trigger specific actions.
Built for customization
J-Probe’s design emphasizes customization. Every aspect of the tool is customizable, from the appearance of the GUI modules to their functionality. You can arrange and resize elements as needed, making it easy to create a testing environment that fits your specific needs. No matter if you’re testing a washing machine, a coffee maker, or a complex automotive system, J‑Probe allows you to tailor the interface to the variables and conditions you need to monitor.
The tool also leverages SEGGER’s High-Speed Sampling technology, enabling sampling rates of over 1 kHz. This is particularly advantageous for graphs, which benefit from the high sampling speed.
Data acquisition doesn’t interfere with the real-time performance of your application. This means you can monitor and interact with your system without impacting its behavior, making J-Probe a nonintrusive yet powerful testing tool.
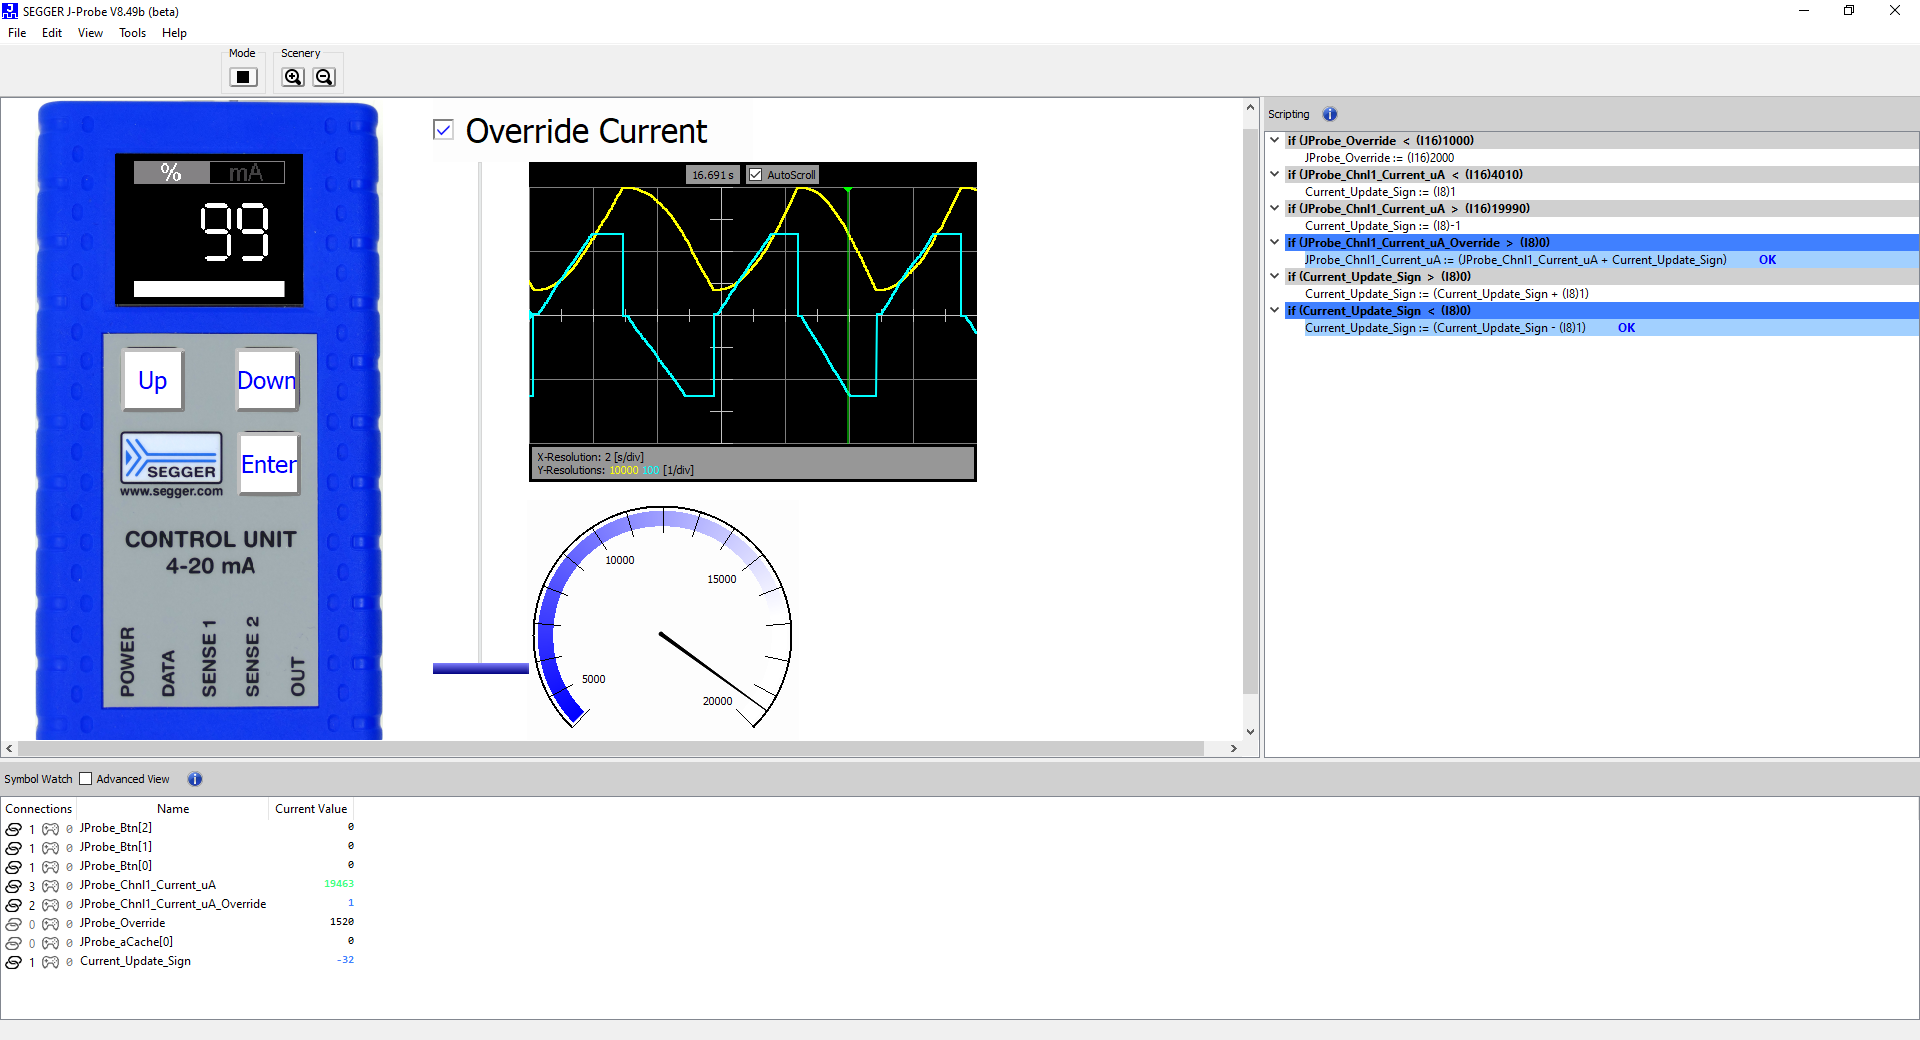
Run Mode View – Live dashboard showing real-time variable updates, graphical data plots, and gauge visualization during system operation.
In addition to variable monitoring and control, J‑Probe also supports frame buffer visualization. If the application on the target device generates a graphical output and stores it in memory, J‑Probe can read this image data and display it on the host system.
Versatile applications
The potential applications for J-Probe are vast. From household appliances like washing machines and coffee makers to critical systems in automobiles, J‑Probe provides a valuable tool for product testing. After all, when you’re testing a complex system like a car, you don’t want to hope everything works perfectly—you want to know it does. J‑Probe gives you the tools to ensure your application is reliable, stable, and ready for the real world.
Try it out, and let us know what you think
For now, we’re offering J-Probe on Windows only, but we plan to make it available across several platforms in the future. To start testing right away, you can download the application, along with the necessary DLLs and a demo project. While we can’t guarantee flawless performance just yet, your input is invaluable in helping us improve J‑Probe and fix any issues that may arise.
What’s next?
We’re excited to see how you use J‑Probe to improve your own development processes, and we look forward to working together to refine the tool. Once we’ve gathered enough feedback and ironed out any remaining issues, we plan to officially release J-Probe as part of our J‑Link product family.
Download J-Probe here, check out the user manual here, and let us know what you think.